Changing Incident Patterns
With a recent Guardian article and NFCC comment raising concerns about cuts to fire and rescue services, I’ve explored the underlying data on how incident volumes and types have evolved over the last ten years.
6/5/20252 min read


Following the NFCC’s post and today's Guardian article on potential £1bn cuts to the fire and rescue sector (link), I’ve taken a closer look at how incident volumes have changed over the past decade.
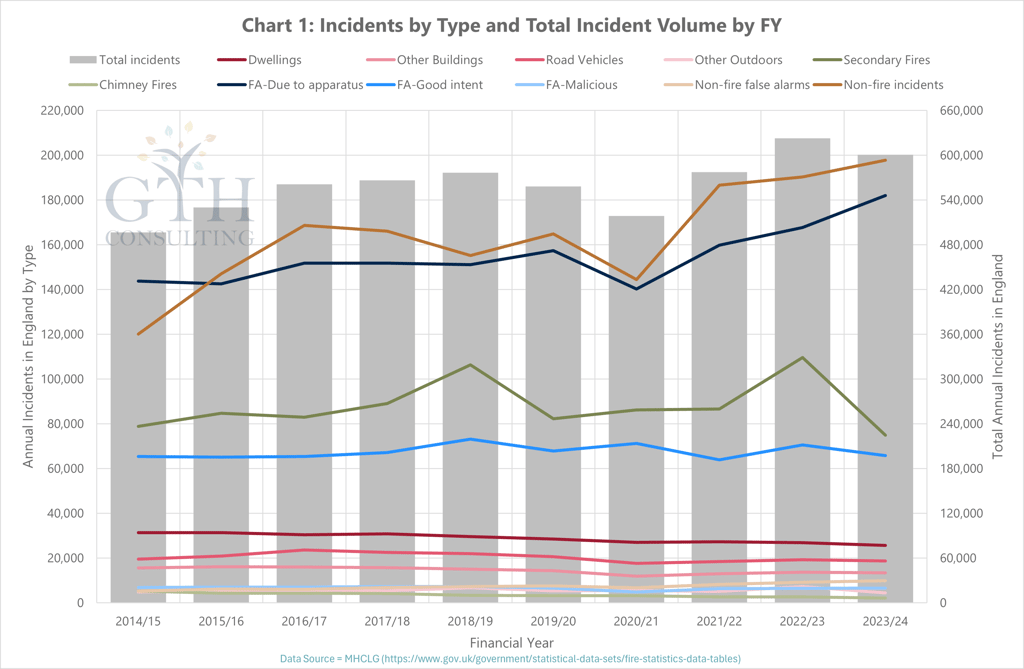
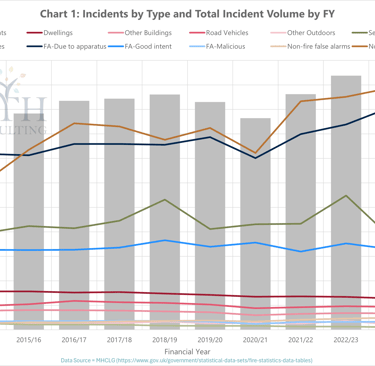
Total incidents in England are up 21% from 496,000 in 2014/15 to 600,000 in 2023/24 (based on the latest published stats from MHCLG).
But it’s the type of incidents that tell the real story (see Chart 1):
Primary Fires down by 13% - a significant success.
Secondary Fires down by 5% - though closely tied to weather and likely to rise again.
False Alarms (due to apparatus) increased by 27% - despite local action to reduce them.
The most striking change is in non-fire incidents, up 66% over the same period. These now account for over 200,000 incidents annually (including non-fire false alarms).
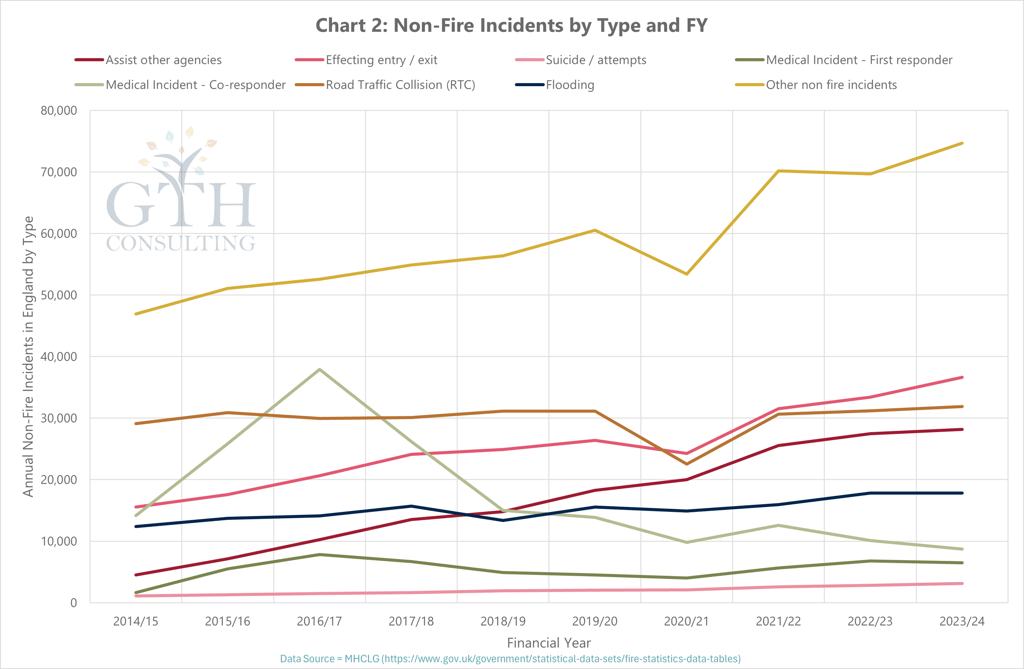
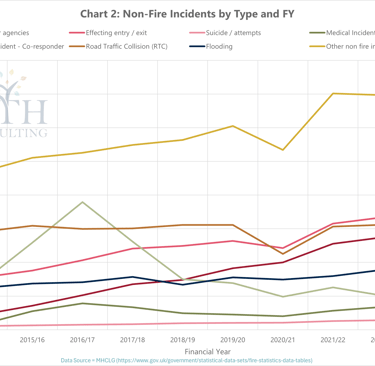
Within the non-fire category (see Chart 2), some of the changes are even more dramatic:
Assist other agencies = 4,520 to 28,181 (+523%)
Effecting entry / exit = 15,525 to 36,603 (+136%)
Suicide / attempts = 1,101 to 3,113 (+183%)
Medical Incident - First responder = 1,645 to 6,503 (+295%)
Medical Incident - Co-responder = 14,168 to 8,700 (-39%)
Road Traffic Collision (RTC) = 29,091 to 31,860 (+10%)
Flooding = 12,391 to 17,797 (+44%)
Other non-fire incidents 46,899 to 74,691 (+59%)
The ‘other non-fire’ sub-category captures a range of different incident types, and Chart 3 highlights changes in the ten most common.
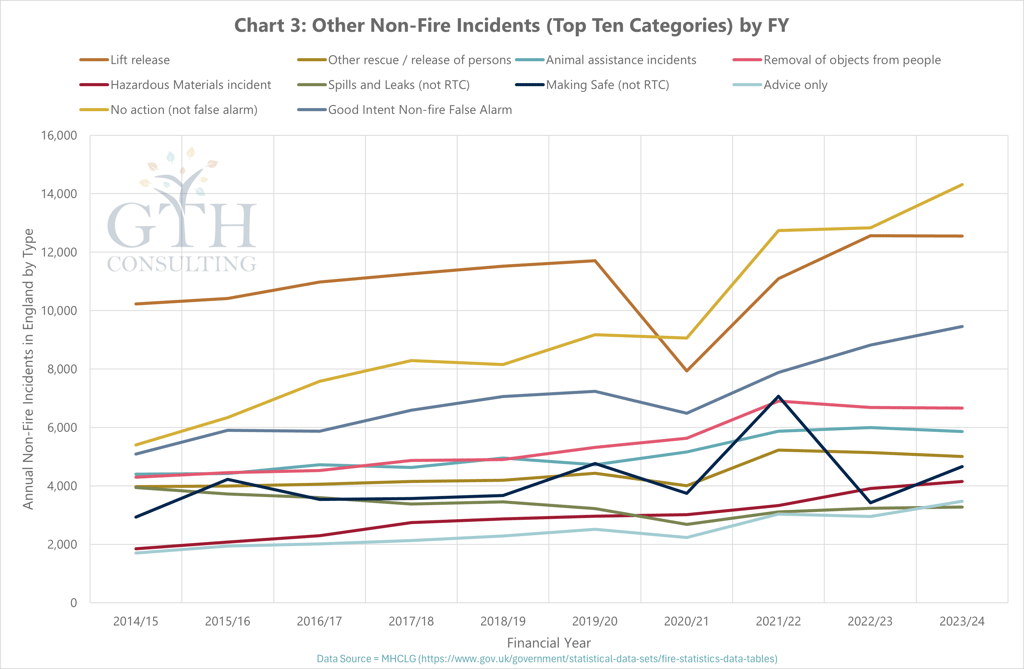
At each level of detail, there are many reasons for these shifts, from changing societal needs to new operational policies, but the trend is clear: fire and rescue services are dealing with a broader, more complex workload than ever before.
Next week, I’ll be exploring how much response time really affects incident outcomes, which becomes a vital question as incident volumes rise and budgets face potential cuts.
All data sourced from MHCLG fire statistics: https://www.gov.uk/government/statistical-data-sets/fire-statistics-data-tables